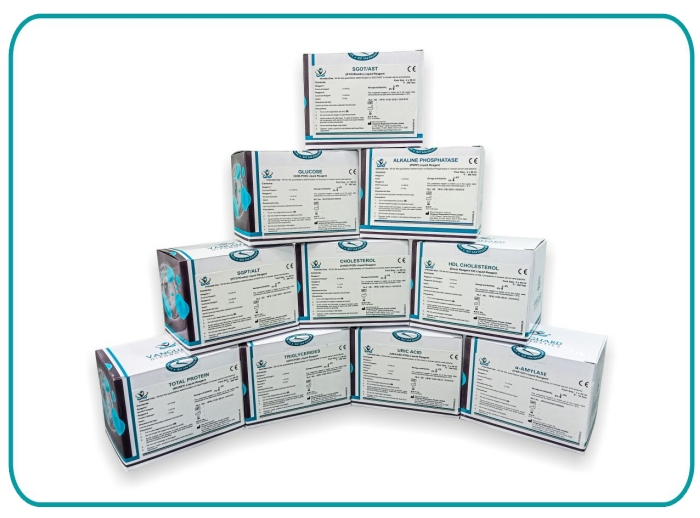
Biochemistry Reagents
Vanguard Diagnostics, a renowned name in the diagnostics sector, offers a variety of high-quality Biochemistry Reagents. These products offer single reagents in the liquid stable format. We offer human serum calibrators in place of simple standards in order to ensure matrix parity and accuracy of results.
Our Biochemistry Reagents rigorously formulated and quality tested, often surpass industry standards. They are crucial for determining biochemical markers for diabetes, lipid profile, liver function, kidney function amongst others. Vanguard Diagnostics’ Reagents are compatible with a wide spectrum of Biochemistry analyzers. This compatibility ensures seamless integration into any lab’s testing processes, enhancing both efficiency and accuracy.
Biochemistry reagents, a specialized sector of medical science, plays an instrumental role in diagnosing various diseases, understanding patient metabolism, and evaluating treatment effectiveness. Central to these processes are Biochemistry reagents, which facilitate the analysis of body fluids, predominantly blood and urine, to determine their chemical composition.
Why are Biochemistry Reagents needed?
Diagnostic Accuracy: Biochemistry reagents interact with specific compounds in patient samples, allowing for precise measurements. This precision helps healthcare professionals accurately diagnose a range of conditions, from diabetes to liver and kidney disorders, amongst others.
Broad Spectrum Analysis: Modern medicine recognizes the complexity of human health and the myriad of factors affecting it. Biochemistry reagents reagents help in analyzing a wide range of metabolites, proteins, and enzymes, presenting a comprehensive health overview.
Swift Results: Quick diagnosis leads to timely treatment. Using these reagents, many automated analyzers can provide rapid results, essential for critical care situations.
Importance of Biochemistry Reagents
Reliable Health Assessments: The efficacy of Biochemistry reagents ensures that test results are consistent and reliable, which is pivotal for accurate health assessments. Any discrepancies can lead to misdiagnosis, potentially jeopardizing patient health.
Informed Clinical Decisions: Clinicians rely on data-driven insights. The results derived from these reagents provide crucial biochemical insights, guiding doctors in prescribing the right treatment, adjusting medication doses, or recommending lifestyle changes.Monitoring Disease Progression: Many conditions, like kidney diseases or certain types of cancers, require regular monitoring. Biochemistry reagents offer consistent evaluations, helping doctors track disease progression or regression.
Vanguard Diagnostics has prepared an evaluation report on 11 Clinical Chemistry products for Diagno Labs’ review.
The 11 parameters selected were as under:
| 1 | Glucose |
| 2 | Creatinine |
| 3 | Urea |
| 4 | Uric Acid |
| 5 | Triglycerides |
| 6 | Cholesterol |
| 7 | SGOT |
| 8 | SGPT |
| 9 | Total Protein |
| 10 | Albumin |
| 11 | Amylase |
Accuracy Studies: Benchmarking against Diasys
- Coefficient of Correlation (r) was calculated using reagents of Diasys as the reference.
- Number of samples tested were = 33.
- Linear regression curves were plotted for the 11 parameters.
- There was an excellent correlation found between the results obtained with Diasys and Vanguard Diagnostics’ products.
- The value of (r) ranged between 0.999 and 0.949 for the 11 parameters tested.
- An “Ideal Line” was plotted on the Coefficient of Correlation graphs to get a visual impression of the closeness of the values obtained with Vanguard Diagnostics products against the ideal curve of the Diasys products.
Precision Studies: Within Run & Between Run
- “Within Run” and “Between Run” precision studies were carried our using Low and High Biorad Controls in order to cover the normal and abnormal ranges for the 11 parameters.
- In all the runs, the number of replicates were equal to 25.
- The Coefficient of Variation (CV %) in the “Within Run” precision studies ranged between 0.21% and 3.12%
- The Coefficient of Variation (CV %) in the “Between Run” precision studies ranged between 0.49% and 3.04%
Accelerated Stability Studies: at 37° C till 28 days
The reagents for all 11 parameters were found to be stable till 4 weeks at 37°C.
Inferences: Accurate, Precise & Stable
- The 11 Clinical Chemistry parameters from Vanguard Diagnostics were found to be accurate when compared with Diasys as benchmark.
- The 11 Clinical Chemistry parameters from Vanguard Diagnostics were found to give precise results.
- The 11 Clinical Chemistry parameters from Vanguard Diagnostics were found to be stable even when exposed to accelerated temperature conditions of 37°C.
| Sr. No. | Product | Method | Type | No. of Reagents | Standard/Calibrator Provided in the kit |
|---|---|---|---|---|---|
| 1 | Glucose | GOD – POD End Point | Liquid stable | 01 | 01 |
| 2 | Creatinine | Modified Jaffe Initial Rate | Liquid stable | 01 | 01 |
| 3 | Urea | GLDH, UV Initial Rate | Liquid stable | 02 | 01 |
| 4 | Uric Acid | Uricase – POD End Point | Liquid stable | 01 | 01 |
| 5 | Triglycerides | GPO – POD End Point | Liquid stable | 01 | 01 |
| 6 | Cholesterol | CHOD-POD End Point | Liquid stable | 01 | 01 |
| 7 | SGOT | IFCC Kinetic | Liquid stable | 02 | – |
| 8 | SGPT | IFCC Kinetic | Liquid stable | 02 | – |
| 9 | Total Protein | Biuret End Point | Liquid stable | 01 | 01 Calibrator |
| 10 | Albumin | BCG End Point | Liquid stable | 01 | 01 Calibrator |
| 11 | Amylase | CNP- G3 Kinetic | Liquid stable | 01 | – |
Coefficient of Correlation : Accuracy
- The objective was to determine the correlation between the results obtained with the Clinical Chemistry reagents of Vanguard Diagnostics and the benchmarked Clinical Chemistry reagents from Diasys.
- The Coefficient of Correlation (“r”) was calculated for each of the 11 parameters selected. III. The data has been presented in the form of:
| 1 | Sample size |
| 2 | Mean x (x)̄ |
| 3 | Mean y (y)̄ |
| 4 | Intercept (a) |
| 5 | Slope (b) |
| 6 | Regression line equation |
| 7 | Value of “r” |
| 8 | Linear Regression Graph |
| 9 | Raw Data of values |
| 10 | Histograms will be made available at the time of visit |
Note: The correlation coefficient, is a numerical value between -1 and 1 that expresses the strength of the linear relationship between two variables. When “r” is closer to 1 it indicates a strong positive relationship. A value of 0 indicates that there is no relationship. Values close to -1 signal a strong negative relationship between the two variables.
Correlation coefficient formula: There are many formulas to calculate the correlation coefficient (all yielding the same result). We used the following:

Where n is the total number of samples, xi (x1, x2,…, xn) are the x values and yi are the y values.
Coefficient of Correlation (“r”): Glucose
x = Glucose reagent from Diasys.
y = Glucose reagent from Vanguard.
“r” = 0.998
Sample size: 33
Mean x (x̄): 72.226666666667
Mean y (ȳ): 71.088484848485
Intercept (a): -0.46424485418245
Slope (b): 0.99066913932067Regression line equation: y=0.99066913932067x-0.46424485418245

Coefficient of Correlation (“r”): Creatinine
x = Creatinine reagent from Diasys.
y = Creatinine reagent from Vanguard.
“r” = 0.987
Sample size: 33
Mean x (x̄): 0.84727272727273
Mean y (ȳ): 0.81818181818182
Intercept (a): -0.0089840025426436
Slope (b): 0.97626867252887
Regression line equation: y=0.97626867252887x-.0089840025426436

Coefficient of Correlation (“r”): Urea
x = Urea reagent from Diasys.
y = Urea reagent from Vanguard.
“r” = 0.999
Sample size: 33
Mean x (x̄): 21.724242424242
Mean y (ȳ): 21.132727272727
Intercept (a): 0.27421898694367
Slope (b): 0.96014893769125
Regression line equation: y=0.27421898694367+0.96014893769125x

Coefficient of Correlation (“r”): Uric Acid
x= Uric Acid reagent from Diasys.
y= Uric Acid reagent from Vanguard.
“r” = 0.993
Sample size: 33
Mean x (x̄): 5.3451515151515
Mean y (ȳ): 5.3169696969697
Intercept (a): 0.20452699231826
Slope (b): 0.9564635708004
Regression line equation: y=0.20452699231826+0.95646357080048x

Coefficient of Correlation (“r”): Triglycerides
x= Triglycerides reagent from Diasys.
y= Triglycerides reagent from Vanguard.
“r” = 0.999
Sample size: 33
Mean x (x̄): 139.57787878788
Mean y (ȳ): 143.14242424242
Intercept (a): -6.7775291369935
Slope (b): 1.0740953701357
Regression line equation: y=1.0740953701357x-6.7775291369935
Coefficient of Correlation (“r”): Cholesterol
x= Cholesterol reagent from Diasys.
y= Cholesterol reagent from Vanguard.
“r” = 0.996
Sample size: 33
Mean x (x̄): 167.42212121212
Mean y (ȳ): 171.72181818182
Intercept (a): -2.1958986250955
Slope (b): 1.0387977141119
Regression line equation: y=1.0387977141119x-2.1958986250955
Coefficient of Correlation (“r”): SGOT
x= SGOT reagent from Diasys.
y= SGOT reagent from Vanguard.
“r” = 0.978
Sample size: 32
Mean x (x̄): 31.57625
Mean y (ȳ): 31.7009375
Intercept (a): 1.1062721004411
Slope (b): 0.96891383237588
Regression line equation: y=1.1062721004411+0.96891383237588x
Coefficient of Correlation (“r”): SGPT
x= SGPT reagent from Diasys.
y= SGPT reagent from Vanguard.
“r” = 0.998
Sample size: 33
Mean x (x̄): 35.96
Mean y (ȳ): 34.919696969697
Intercept (a): -0.68283717406223
Slope (b): 0.99005934771299
Regression line equation: y=0.99005934771299x
Coefficient of Correlation (“r”): Total Protein
x= Total Protein reagent from Diasys.
y= Total Protein reagent from Vanguard.
“r” = 0.983
Sample size: 33
Mean x (x̄): 7.0630303030303
Mean y (ȳ): 7.1542424242424
Intercept (a): 0.082214090074015
Slope (b): 1.0012739618481
Regression line equation: y=0.082214090074015+1.0012739618481x
Coefficient of Correlation (“r”): Albumin
x= Albumin reagent from Diasys.
y= Albumin reagent from Vanguard.
“r” = 0.949
Sample size: 33
Mean x (x̄): 4.7169696969697
Mean y (ȳ): 4.680303030303
Intercept (a): 0.13486184082032
Slope (b): 0.96363586825729
Regression line equation: y=0.13486184082032+0.96363586825729x
Coefficient of Correlation (“r”): Amylase
x= Amylase reagent from Diasys.
y= Amylase reagent from Vanguard.
“r” = 0.996
Sample size: 33
Mean x (x̄): 75.212121212121
Mean y (ȳ): 72.805454545455
Intercept (a): 0.4031065943736
Slope (b): 0.96264201546562
Regression line equation: y=0.4031065943736+0.96264201546562x
Coefficient of Variation : Precision
- Biorad Controls Normal and Abnormal were used to calculate “Within Run” and “Between Run” Precision.
- The Biorad Controls were tested in 25 replicates to study Precision.
- Coefficient of Variation (CV %) was calculated.
Within Run CVs ranged between 0.21% and 3.12%
Between Run CVs ranged between 0.49% and 3.04%
Vanguard brand Biochemistry Reagents Reagents for all open/ partially open models

Albumin with human protein calibrator
Alkaline Phosphatase, Liquid Stable
Amylase, Single Reagent
Bilirubin, Total & Direct
Calcium, Arsenazo III (available in mono-vials also)
Cholesterol, Single Reagent
Creatinine, Single Reagent & Two Reagents
Creatine Kinase, Liquid Stable
Creatine Kinase MB, Liquid Stable
Gamma GT, Liquid Stable
Glucose, Single Reagent
HDL Cholesterol Direct, Enzymatic
Immunoturbidity Method RF
Immunoturbidity Method CRP
Immunoturbidity Method ASO
LDL Cholesterol Direct, Enzymatic
Lipase
Microprotein, Pyrogallol Red
SGOT, Highly stable NADH based
SGPT, Highly stable NADH based
Total Protein with human protein calibrator
Triglycerides, Single Reagent
Urea UV, Berthelot & Salicylate
Uric Acid, Single Reagent